Hotjar - visualising website data
Because we spend every day reading tech articles to keep ahead of the curve, Facebook will often give us 'suggested' posts or pages for tools to help out on websites. We'll tend to give them a test and every now and then one will impress us enough with it's functionality and pricing to start using regularly and recommend to our clients - HotJar seems to fall into that category.
What is HotJar?
In a nutshell, HotJar creates 'heat maps' on your website - showing you exactly where people are clicking, scrolling and moving on different pages on your site. It gives you the ability to quickly understand how people are using your site - which in turn can help you make changes to the site to make it more effective. Below we've given a very brief overview of some of the features and what they do.
The heatmaps
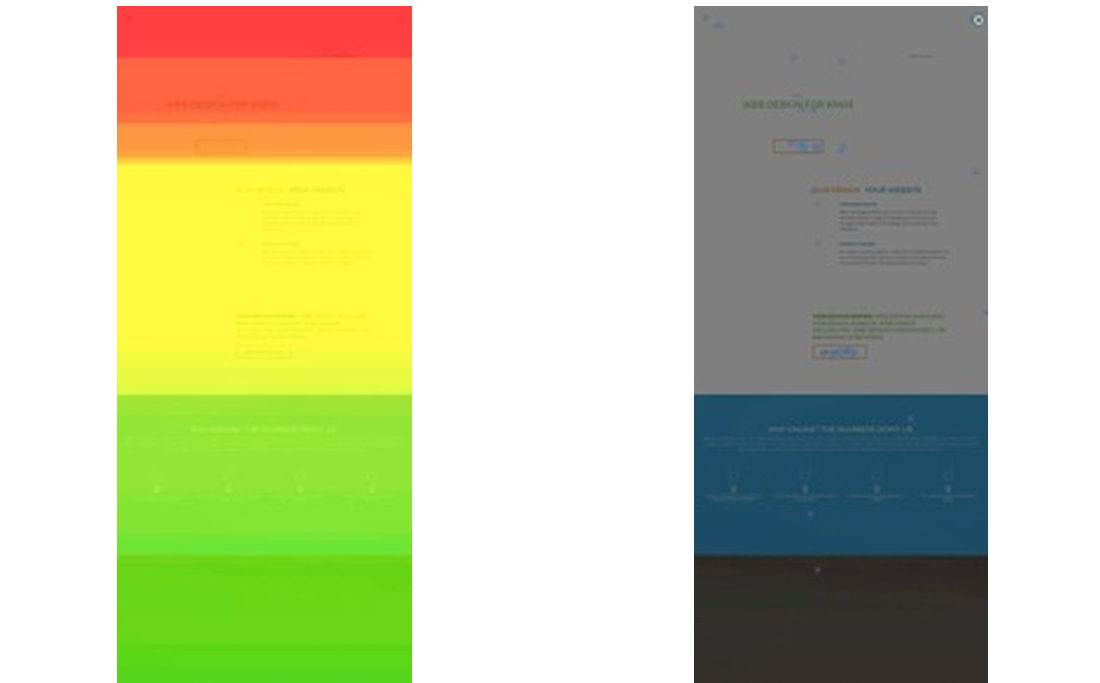
The aspect of HotJar that most people will immediately be drawn to are the heatmaps generated for the site. It shows you how users are interacting with your website design on a computer, mobile and tablet - showing you where they move their mouse, click, and how far down the page they navigate. It can be really intriguing information and if used correctly, should give you an understanding of why your site may or may not be converting into sales. Below are a couple of the heatmaps we generated for our homepage over a few days. What we learned pretty quickly is that twice as many people viewed the site on a computer as a mobile, and next to no-one did on a tablet. That's good info for us - and that stat will no doubt change from industry to industry...but it shows how important the mobile version of a site is. Other than that, what you'll see in the graphics is the attrition rate from the top to the bottom of our single scrolling website. Only about 30% of users make it all the way down to our contact form - which is real food for thought and something we'll put our mind to in tweaking our site in the future.
Heat map of scrolling on the 543 homepage. From red being 100% of people viewing that part of the page, down to the blue area of about 30%.

The 'click' heatmap - you'll see blue spots below where users on the desktop version click on our homepage - giving us an appreciation of how well the site is working.

The other features
HotJar comes with a whole stack of other features that some users will really love. You can choose to have each user's journey on your site recorded. This is a fantastic little piece of insight as you can literally sit and watch where the user's mouse tracks on your page. It's an excellent way to see what parts of the site people may be moving away from, where they are trying to click or move on the page, and just in general get an understanding for whether your site is getting used as you want it to be.
Another feature that the HotJar team suggest you use is the 'poll' and 'survey' pop ups - which appear on your site and askusers a question about what they think about the site. We can see the benefit of asking questions of your users (whether there is anything that they want to see on the site, or if they had any issues), but with our site already having a 'sales' point pop up, we didn't want to be too intrusive to people on it so didn't test these particular features.
The final feature that we think alot of clients will get a kick out of is the contact form monitoring tool. By creating a form with HotJar, you will be able to identify exactly where on the form you are possibly losing customers. For websites that utilise a big contact form, that could be extremely useful - helping you refine your forms so that you make sure you hear from everyone who starts to get in touch. Again, with a contact form of only three fields on our site, we didn't give this feature a run, but will do so further down the track.
The verdict
All in all we found HotJar very useful. It's easy to set up (you just need to drop a little snippet of code onto the pages on your site you want to monitor - something easily done by your web team), and the data is pretty instant and understandable. Cost wise, there is a free version for sites with smaller amounts of traffic - which will probably suit most small businesses in New Zealand. We've already had a couple of clients look to start using it, and if you take the time to analyse the data and actually make changes based on that feedback it could be an incredibly powerful tool.
Find out more at HotJar:
https://www.hotjar.com/